Friday April 22 CSL Meeting
Apr 21, 2022 - CSL

Angela Khong
Interannual Variability of the West African Monsoon using the Rainy and Dry Seasons Dataset
Presenter: Angela Khong
Time: Friday, 22 April 2022, 2:00 p.m.
Location: 805 O&M
Abstract: The West African Monsoon (WAM) is the primary source of precipitation in West Africa; thus, the dependability and timely arrival of the annual rains are vital for food security, economic growth, and the overall health of this region. With the consequences of climate change in mind, further understanding of the mechanism that drives the temporal and spatial distribution of rainfall variability in West Africa would greatly benefit the stakeholders of this region. Using the Rainy and Dry Season (RADS) dataset, this study sought to statistically determine the role of remote climate indices on the spatiotemporal distribution of WAM dynamics from 1982-2018 using correlation and regression analysis. Specifically, three sea-surface temperature (SST) indices, Niño3.4, Dipole Mode Index/Indian Ocean Dipole (DMI), and Atlantic Niño /Equatorial Mode (EM), were used to represent the state of the Pacific, Indian, and Atlantic Ocean basins, respectively, to determine the influence on WAM total wet season precipitation (TWSP), onset date, and demise date in West Africa. Further examining the spatial influence of each SST index in West Africa, our study region was delineated into three latitudinal zones: Guinean Coast, Transition zone, and Sahelian zone. The results revealed the Guinean Coast experienced increased TWSP during periods of low SST in the tropical Pacific and high SST in the tropical Atlantic Ocean (and vice versa). On average, WAM onset and demise dates have been occurring later in the summer than usual, except for the Guinean Coast onset which has been occurring earlier. During periods of high DMI, the Transition zone experienced delayed rainy seasons, while low DMI are associated with earlier WAM onsets. WAM demise did not yield significant correlations with any of the three SST indices at the 95% confidence level. From the multiple regression analysis, we found all three remote indices to account for 21-73% TWSP variability and 20-55% for both onset and demise variability.
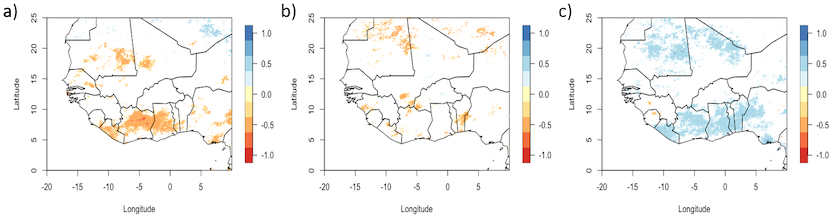 Spatial distribution of correlation coefficients of annual Total Wet Season Precipitation and mean annual remote indices from 1982-2018 for a) Niño 3.4, b) Dipole Mode Index/Indian Ocean Dipole, and c) Equatorial Mode/Atlantic Niño using a mask at the 95% significant level and adjusted for multiple comparison effects.