RADS
Rainy and Dry Season (RADS)
What is RADS?
Rainy And Dry Season is a global gridded dataset of the characteristics of the wet and dry seasons. The dataset contains the dates of onset and demise of the rainy season (one date per year), the duration of the rainy and dry seasons, and the accumulated precipitation during the rainy and dry seasons. The methodology for detection of the characteristics of the rainy season is based solely on precipitation data. The dataset was developed from multiple globally gridded daily precipitation datasets and, therefore, shares the spatial resolution, temporal range, and limitations of the original precipitation datasets.
Citation
Bombardi, R. J., J. L. Kinter III, and O. W. Frauenfeld (2019) A Gobal Gridded Dataset of the Characteristics of the Rainy and Dry Seasons. Bulletin of the American Meteorological Society, 100(7), 1315-1328, doi:10.1175/BAMS-D-18-0177.1. [Open Access PDF]
Access Data
Please note: The dataset contains the onset and demise dates, accumulated precipitation during the wet and dry seasons, and the duration of the wet and dry seasons. Onset and demise dates are available in two formats: the actual date (format: YYYY-MM-DDD) and in "Day of Year" [1, 365] (or pentad for CHIRPS [1, 72] and GPCP [1, 73]).
RADS is calculated with precipitation from:
- The Climate Prediction Center Unified Gauge-Based Analysis of Global Daily Precipitation (CPC_UNI; global coverage at 0.5° spatial resolution; 1979-present; Xie et al. 2007; Chen et al. 2008)
- The Climate Hazards Group InfraRed Precipitation with Station data (CHIRPS; 50°S to 50°N coverage at 0.05° x 0.05° spatial resolution; 1981-present; Funk et al. 2015)
- The Global Precipitation Climatology Project (GPCP; 90°S-90°N coverage at 2.5° spatial resolution; 1979-2015; Adler et al. 2003; Huffman et al. 2009)
History and Intent
The characteristics (onset and demise dates, duration, and accumulated precipitation) of the wet and dry seasons have important implications to several sectors of society. On one hand, late rainy season onset dates can have negative impacts on agriculture, leading to yield loss. On the other hand, late rainy season demise can lead to post-harvest loss due to the infection of crops by mold, threatening human health. Moreover, variations in the accumulated precipitation during the rainy and dry seasons have direct implications to sectors related to water resource management, such as agriculture (global food security), energy generation (water and energy), human health and property loss (landslides, floods, water borne diseases, and forest fires).
Dr. Bombardi has been investigating the variability of the timing of the rainy season over monsoonal regions since 2005. This dataset is the culmination of more than a decade of research on ways to best represent onset and demise dates of the rainy season over the globe.
We expect that the RADS dataset will contribute to our understanding of the sources of variability of the timing of rainy seasons (on local-to-regional scales) and monsoons (on large-scales) and their impacts on water resource management and other aspects of geosciences and human activities.
Climatology and Interannual Variability
The climatology and interrannual variability of the characteristics of the rainy season calculated using precipitation from CPC_UNI are presented below:
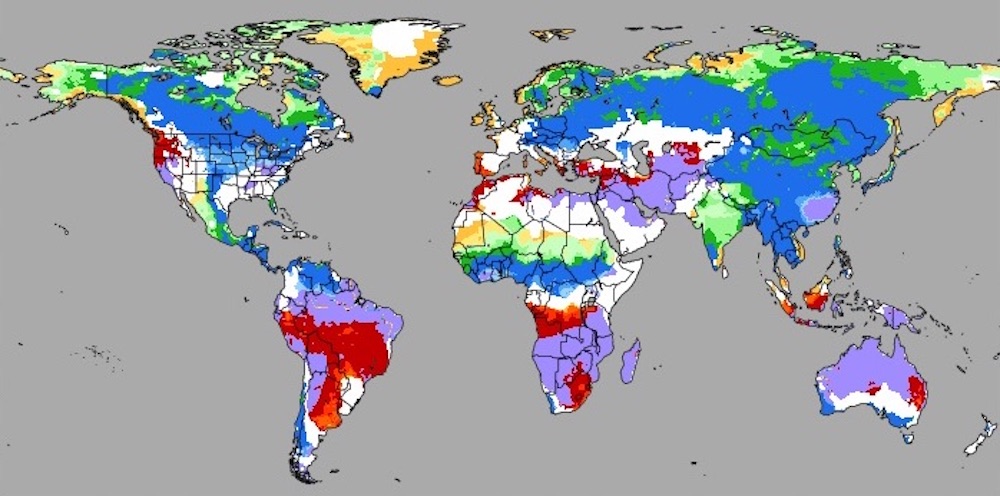
![Median onset date [day of year] and b) Interquartile range of onset dates [days]](../images/med.IQR.onset.png)
a) Median onset date [day of year] and b) Interquartile range of onset dates [days]
![a) Median demise date [day of year] and b) Interquartile range of demise dates [days]](../images/med.IQR.demise.png)
a) Median demise date [day of year] and b) Interquartile range of demise dates [days]
![a) Median duration of the rainy season [days] and b) Interquartile range of the duration of the rainy season [days]](../images/med.IQR.durwet.png)
a) Median duration of the rainy season [days] and b) Interquartile range of the duration of the rainy season [days]
![a) Median duration of the dry season [days] and b) Interquartile range of the duration of the dry season [days]](../images/med.IQR.durdry.png)
a) Median duration of the dry season [days] and b) Interquartile range of the duration of the dry season [days]
![a) Median accumulated precipitation during the rainy season [mm] and b) Interquartile range of the accumulated precipitation during the rainy season [days]](../images/med.IQR.totwet.png)
a) Median accumulated precipitation during the rainy season [mm] and b) Interquartile range of the accumulated precipitation during the rainy season [days]
![a) Median accumulated precipitation during the dry season [mm] and b) Interquartile range of the accumulated precipitation during the dry season [days]](../images/med.IQR.totdry.png)
a) Median accumulated precipitation during the dry season [mm] and b) Interquartile range of the accumulated precipitation during the dry season [days]
References
Adler, R. F., G. J. Huffman, A. Chang, R. Ferraro, P.-P. Xie, J. Janowiak, B. Rudolf, U. Schneider, S. Curtis, D. Bolvin, A. Gruber, J. Susskind, P. Arkin, and E. Nelkin, 2003: The version-2 Global Precipitation Climatology Project (GPCP) monthly precipitation analysis (1979–present). J. Hydrometeor., 4, 1147-1167, doi:10.1175/1525-7541(2003)004<1147:TVGPCP>2.0.CO;2.
Chen, M., W. Shi, P. Xie, V. B. S. Silva, V. E. Kousky, R. W. Higgins, and J. E. Janowiak, 2008: Assessing objective techniques for gauge-based analyses of global daily precipitation. J. Geophys. Res., 113, D04110, doi:10.1029/2007JD009132.
Funk, C., P. Peterson, M. Landsfeld, D. Pedreros, J. Verdin, S. Shukla, G. Husak, J. Rowland, L. Harrison, A. Hoell, and J. Michaelsen, 2015: The climate hazards infrared precipitation with stations—a new environmental record for monitoring extremes. Sci. Data, 2, 150066, doi:10.1038/sdata.2015.66.
Huffman, G. J., R. F. Adler, D. T. Bolvin, and G. Gu, 2009: Improving the global precipitation record: GPCP version 2.1. Geophys. Res. Lett., 36, L17808, doi:10.1029/2009GL040000.
Xie, P., P. A. Arkin, and J. E. Janowiak, 2007: CMAP: The CPC Merged Analysis of Precipitation. In: Levizzani, V., P. Bauer, and F. J. Turk (eds) Measuring Precipitation From Space. Advances In Global Change Research, 28, 319-328. Springer, Dordrecht, doi:10.1007/978-1-4020-5835-6_25.
Climate Hazards Center Infrared Precipitation with Stations version 3. CHIRPS3 Data Repository, 2025, doi:10.15780/G2JQ0P.
