Friday October 14 CSL Meeting
Oct 13, 2016 - CSL

Shanshui Yuan
Assessment of multiple approaches for using soil moisture to evaluate drought in the U.S. Great Plains
Presenter: Shanshui Yuan
Time: Friday 14 October, 2:00-3:00 p.m.
Location: 805 O&M
Abstract: Drought occurs frequently in the U.S. Great Plains and it can have significant impacts on the economy, environment and society. There are a variety of different meteorological and environmental variables that are routinely used to monitor drought conditions, including direct measurements of precipitation, soil moisture and streamflow and indirect measures, like drought indices and model simulations. The newly developed North American Soil Moisture Database (NASMD) provides quality-controlled soil moisture observations to help assess the reliability of these drought monitoring tools. This dissertation assesses the performance of drought indices and model-simulated soil moisture using in situ data from the NASMD. Specifically, the objectives of this dissertation are to: (1) identify the drought index that best represents soil moisture; (2) develop a more physically-realistic drought index and validate it using observed soil moisture; (3) identify the best methodology for estimating observed soil moisture at unsampled locations; and (4) evaluate the accuracy of soil moisture simulations in the Earth System Models that are part of CMIP5.
The results demonstrate that the Crop Moisture Index (CMI) is the most suitable drought index for representing soil moisture conditions in the top 100 cm of the soil. It has the highest correlation with observed soil moisture and it also agrees with the observations in terms of the temporal trend and persistence. CMI is the drought index that is best able to capture the observed variability in soil water content in the top 100 cm of the soil. However, when examining soil water content in the top 10 cm of the soil, there is no single drought index that clearly outperforms the others. In general, drought indices considering potential evapotranspiration (PET) are more appropriate for representing soil moisture in 0-10 cm soil layer.
Given the results of Objective 1, it was necessary to develop a drought index that provides a more physically-realistic representation of PET than the traditional Thornthwaite approach. Therefore, a new version of the Palmer Drought Severity Index (PDSI) was developed that uses a two-source PET model. Based on a comparison with original PDSI and the Penman-Monteith-based PDSI, we found that the choice of the PET method can have a significant impact on the spatial and temporal patterns of drought and drought severity during extreme events.
A third challenge of working with in situ soil moisture is that stations are sparsely distributed and so it is frequently necessary to estimate soil moisture at unsampled locations. Given that soil moisture is highly spatially heterogeneous, traditional interpolation approaches may not perform well. Therefore, we evaluated a new method for interpolating soil moisture. The reduced optimal interpolation (ROI) method use both in situ and model-simulated soil moisture to estimate soil moisture at unsampled locations. ROI was significantly more accurate than inverse distance weighting (IDW) and Cokriging.
Finally, the accuracy of soil moisture in Earth system models (ESMs) was evaluated using in situ and satellite observations. The results show that models can reproduce the seasonal variability in soil moisture over CONUS, but they tend to systematically over-estimate soil water content in the western U.S. and under-estimate soil water content in the eastern U.S. While there are significant regional and inter-model variations in performance, the models that performed best in this assessment are HadGEM2-ES in 0-100 cm soil layer and CCSM4 in 0-10 cm soil layer.
In summary, this doctoral research has evaluated existing methods and developed new methods for improving the accuracy of various soil moisture proxies. This work lays the foundation for future research on hydroclimatic variability and the impacts of climate change on drought frequency and severity.
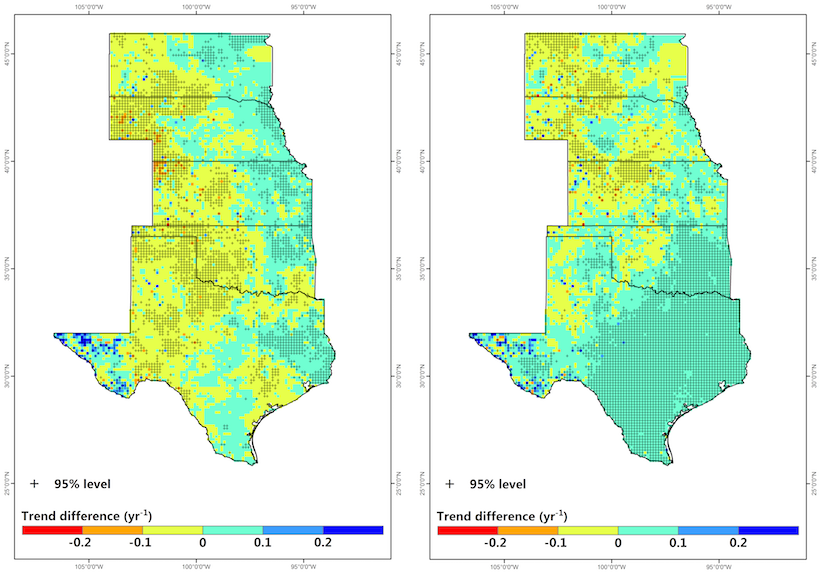 Difference of trends in the PDSI (left) between the 2S and the PM, (right) between the 2S and the TH. Statistically significant trends at the 95% level are indicated by a cross.