Friday April 8 CSL Meeting
Apr 7, 2022 - CSL

Bailey Skinner
A Multiple Linear Regression Model of Aragonite Saturation State in the Remote North Pacific
Presenter: Bailey Skinner
Time: Friday, 8 April 2022, 2:00 p.m.
Location: 805 O&M
Abstract: Increasing oceanic uptake of carbon dioxide (CO2), driven by anthropogenic carbon emissions, leads to increased seawater CO2, decreased pH, and a concurrent decrease in aragonite saturation state (Ωar). This process, called ocean acidification (OA), can negatively impact organisms that form calcium carbonate skeletons, including deep-sea corals. OA also results in the shoaling of the aragonite saturation horizon (ASH, Ω=1), below which water is undersaturated with respect to aragonite. Water column chemistry was characterized during 5 cruises with the sporadic reoccupation of 9 sites in the Northwestern Hawaiian Islands (NWHI) and Emperor Seamounts from 2014-2017. This area is remote and home to recently discovered deep-sea coral reefs that are living near or below the ASH. Here, we applied a previously developed method for the Pacific Northwest region (PNW model) to determine Ωar using a multiple linear regression model of commonly measured environmental parameters, including temperature (T) and oxygen (O2), to derive regression coefficients to best fit the NWHI dataset (NWHI model). We divided the 4 years of data into a model training population (2014 and 2015) and model validation population (2016 and 2017). The NWHI model showed a stronger correlation between modeled and measured Ωar (R2=0.628) than the PNW model (R2=0.483) in the training population. For the validation dataset, the NWHI model yielded an R2=0.633. The NWHI model underestimated Ωar compared to measured values at all depths, while the PNW model underestimated Ωar above 500 m depth and overestimated Ωar below 500 m. The NWHI model underestimated Ωar by a constant offset of 0.6 and was therefore easily corrected. The NWHI model was further tested and refined using GO-SHIP data, with the goal of constraining changes in Ωar over the last 3 decades in the remote North Pacific to provide a better understanding of changes in ASH depth using more easily accessible data.
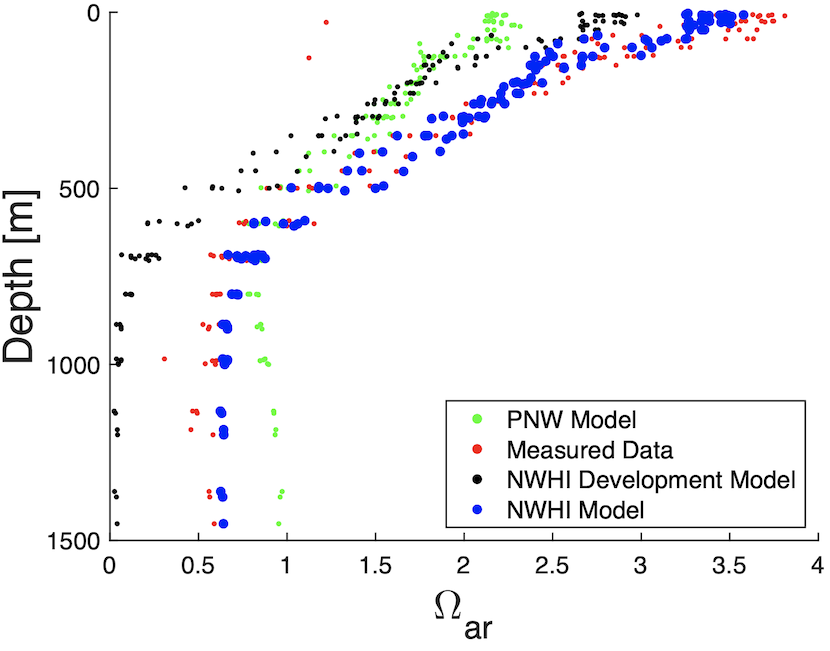 Comparison of correlation values during the NWHI Model development between the Measured Data (red) and the PNW Model (green) (R2= 0.4830); the Measured Data to the NWHI Development Model (black) (R2=0.6275; and the Measured Data to the NWHI Model (blue) (R2=0.9398).